Examples
We here collect examples for using the package to demonstrate some of its functionality.
Basic droplets
The basic droplet classes can be used as follows
from droplets import DiffuseDroplet, Emulsion, SphericalDroplet

# construct two droplets
drop1 = SphericalDroplet(position=[0, 0], radius=2)
drop2 = DiffuseDroplet(position=[6, 8], radius=3, interface_width=1)

# check whether they overlap
print(drop1.overlaps(drop2))  # prints False

# construct an emulsion and query it
e = Emulsion([drop1, drop2])
e.get_size_statistics()
We first create two droplets represented by two different classes. The basic
class SphericalDroplet represents a droplet by its
position and radius, while the more advanced class
DiffuseDroplet also keeps track of the interface
width.
Finally, we combine the two droplets in an emulsion, which then allows further
analysis.
Plotting emulsions
To visualize an emulsions, one can simply use the
plot():
import numpy as np

from droplets import DiffuseDroplet, Emulsion

# create 10 random droplets
droplets = [
    DiffuseDroplet(
        position=np.random.uniform(0, 100, 2),
        radius=np.random.uniform(5, 10),
        interface_width=1,
    )
    for _ in range(10)
]

# remove overlapping droplets in emulsion and plot it
emulsion = Emulsion(droplets)
emulsion.remove_overlapping()
emulsion.plot()
Note that the emulsion class can also keep track of the space in which droplets
are defined, e.g, the boundaries of a simulation grid.
For this, the Emulsion supports the grid
argument, which can for instance be an instance of
CartesianGrid.
Analyze images
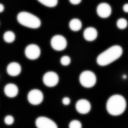
An emulsion image
The package also allows analyzing images of emulsions like the one shown on the right. The code below loads the image, locates the droplets, and then displays some of their properties
from pathlib import Path

from pde.fields import ScalarField

from droplets.image_analysis import locate_droplets

img_path = Path(__file__).parent / "resources" / "emulsion.png"
field = ScalarField.from_image(img_path)
emulsion = locate_droplets(field)

# visualize the result
emulsion.plot(field=field, fill=False, color="w")
Note that the determined positions and sizes of the droplets are only roughly
determined by default.
If more accurate data is desired,
locate_droplets() supports the refine
arguments, which fits the model image of droplet to the actual image to obtain
more accurate parameter estimates.